
Page 13 - Annual Research Report 2018-19
P. 13
8
RESEARCH ACTIVITIES ACROSS COLLEGES
& FP
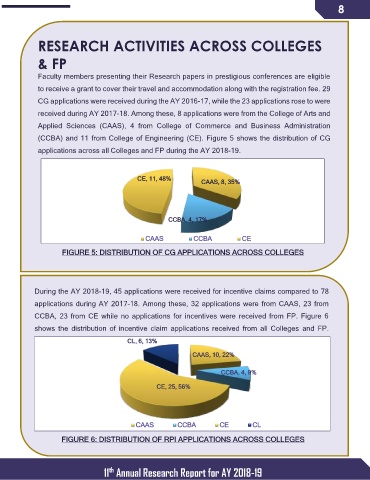
Faculty members presenting their Research papers in prestigious conferences are eligible
to receive a grant to cover their travel and accommodation along with the registration fee. 29
CG applications were received during the AY 2016-17, while the 23 applications rose to were
received during AY 2017-18. Among these, 8 applications were from the College of Arts and
Applied Sciences (CAAS), 4 from College of Commerce and Business Administration
(CCBA) and 11 from College of Engineering (CE). Figure 5 shows the distribution of CG
applications across all Colleges and FP during the AY 2018-19.
CE, 11, 48%
CAAS, 8, 35%
CCBA, 4, 17%
CAAS CCBA CE
FIGURE 5: DISTRIBUTION OF CG APPLICATIONS ACROSS COLLEGES
During the AY 2018-19, 45 applications were received for incentive claims compared to 78
applications during AY 2017-18. Among these, 32 applications were from CAAS, 23 from
CCBA, 23 from CE while no applications for incentives were received from FP. Figure 6
shows the distribution of incentive claim applications received from all Colleges and FP.
CL, 6, 13%
CAAS, 10, 22%
CCBA, 4, 9%
CE, 25, 56%
CAAS CCBA CE CL
FIGURE 6: DISTRIBUTION OF RPI APPLICATIONS ACROSS COLLEGES
esearch
11 Annual Research Report for AY 2018-19
th